GLIMS Journal of Management Review and Transformation

 Search
Yudhajit Roy1 and Kanupriya1 
1 Department of Economics, Indian Institute of Foreign Trade (IIFT), New Delhi, India

Creative Commons Non Commercial CC BY-NC: This article is distributed under the terms of the Creative Commons Attribution-NonCommercial 4.0 License (http://www.creativecommons.org/licenses/by-nc/4.0/) which permits non-Commercial use, reproduction and distribution of the work without further permission provided the original work is attributed.
Digital transformation has impacted the profitability of India’s five leading FMCG firms, including Dabur, Hindustan Unilever Limited (HUL), Godrej Consumer Products Limited (GCPL), ITC and Nestlé. The study evaluates how these digital initiatives have improved financial resilience and efficiency, highlighting net cash flow growth, net profit margin, return on capital employed (ROCE), inventory turnover and gross profit margin. Companies that leverage AI, predictive analytics and digital-first strategies drive more profit and are more agile to market shifts. However, the effects differ due to investment, implementation and market positioning. Companies that adopt a data-driven approach have competitive advantages, while those slow to adopt a digital strategy face changing industry dynamics. Long-term digital success requires investment in scalable digital infrastructure, innovation and workforce upskilling. Policymakers should incentivise digital adoption, conduct research and establish rigorous data protection. Future research could focus on tracking digital performance, assessing the impact of sustainability-driven digital strategies and comparing across industries to improve best practices.
Digital infrastructure, digital transformation, FMCG sector, innovation, profitability, workforce upskilling
Introduction
The Fast-Moving Consumer Goods (FMCG) sector stands as one of the four foundational pillars of the Indian economy, ranking as one of its largest contributors. In 2023, its market size reached US$167 billion, with projections indicating a compound annual growth rate (CAGR) of 27.9% from 2021 to 2027, potentially elevating the total to nearly US$615.87 billion. Approximately 65% of the demand originates from urban regions, while rural demand, accounting for over 35%, is expected to increase due to enhanced government spending and improvements in agricultural productivity. This sector encompasses a wide range of products, including food and beverages, personal care items, household goods and healthcare products. Notably, India’s food processing market was valued at US$307.2 billion in 2022 and is on track to achieve a CAGR of 9.5%, reaching US$547.3 billion by 2028. Digital transformation plays a crucial role in facilitating growth, reshaping work processes, consumer interactions and supply chain management. With 780 million internet users, India is projected to contribute approximately US$9.92 billion, or 42% of the FMCG sector’s total digital expenditure in 2023. The online shopping sector is expanding rapidly, with forecasts suggesting that the Indian e-commerce market will surge from US$83 billion in 2022 to US$185 billion by 2026, and gross merchandise value (GMV) is expected to reach US$350 billion by 2030 (Aditya Birla Capital, 2025; Statista, 2025).
Market projections indicate a robust growth trajectory with a CAGR of 14.9%, leading the industry to an anticipated value of $220 billion by 2025–2026. Traditional FMCG companies are encountering significant competition from Direct to Customer (D2C) unicorns, which are making substantial inroads through digital-first strategies. With changing times, e-commerce and digital advertising have emerged as key players. Despite the sector’s impressive growth, challenges such as inflation, supply chain disruptions, increasing raw material costs and cybersecurity concerns persist. However, trends like AI-driven demand forecasting, blockchain-enhanced supply chain management and D2C business models present promising growth avenues. Additionally, rising disposable incomes, increased digital adoption and supportive policies are expected to propel India towards becoming a trillion-dollar FMCG industry in the future (Aditya Birla Capital, 2025; Statista, 2025).
The Indian FMCG sector is currently experiencing a digital transformation that is significantly altering the operational strategies of brands in terms of enhancing efficiency, engaging consumers, and penetrating markets to foster a sustainable future. As consumer behaviour shifts towards e-commerce, personalisation and convenience, FMCG companies are increasingly adopting technologies such as artificial intelligence (AI), big data, the Internet of Things (IoT) and automation to streamline their operations in response to this evolving landscape. The traditional pathways through which FMCG products reached consumers have undergone a fundamental change with the rise of e-commerce and the D2C business model. Key drivers of this digital shift include D2C platforms such as Amazon, Flipkart, BigBasket and JioMart. Furthermore, FMCG brands are at the forefront of digital marketing, accounting for 42% of India’s digital advertising expenditure. Innovations such as AI-driven demand forecasting, IoT-enabled smart warehouses and blockchain-based inventory management are making supply chains more agile than ever. Companies like Hindustan Unilever, ITC and Nestlé India are leveraging automation in their distribution centres to enhance efficiency and reduce costs. Additionally, consumer interactions are being revolutionised through AI-powered chatbots, voice assistants and augmented/virtual reality, providing seamless product discovery and personalised recommendations (Aditya Birla Capital, 2025; Statista, 2025).
The process of digital transformation is bridging the accessibility gaps in rural India. The adoption of digital payments through mobile wallets and UPI, along with mobile-centric strategies and government-backed PLI initiatives, is essential for driving growth in the FMCG sector within non-metro areas. However, challenges such as high implementation costs, limited digital literacy and cybersecurity threats persist. As smartphone usage increases, urbanisation accelerates, and a digitally inclined consumer base emerges, digital transformation has shifted from being a luxury to a necessity for FMCG companies in India. The key players in India’s trillion-dollar FMCG market over the next decade will be those who effectively leverage data analytics, automation and digital-first consumer engagement approaches (Aditya Birla Capital, 2025; Statista, 2025).
This research examines the influence of digital transformation on Key Performance Indicators (KPIs) within India’s FMCG sector, particularly in the context of existing challenges. It specifically evaluates the effects of digital adoption on operational efficiencies (including supply chain optimisation, inventory management and cost reduction, among others), profitability (such as revenue growth, return on investment and EBITDA margins), and customer engagement (including the effectiveness of digital marketing, customer loyalty and personalisation). By addressing these factors, the study aims to offer valuable insights to FMCG companies, policymakers and industry stakeholders on how to enhance digital transformation efforts to ensure sustainable business growth.
Digital transformation has become a crucial driver of change within the FMCG sector, including the Indian FMCG sector. However, despite the promise of digital tools and services to enhance operational efficiency and profitability, their impact varies significantly among different companies and market segments. This study aims to address essential gaps in understanding how digital transformation influences industry performance, particularly within India’s landscape.
Review of Literature
This segment reviews extant literature on the impact of digital initiatives on businesses, with a focus on the FMCG sector.
As per Zhang et al. (2015), RFID Cuboids are a data warehousing solution that helps manage data from RFID technology, improving supply chain management for businesses. They assist manufacturers in tracking materials and finding efficient delivery routes, reduce retrieval time in warehouses, and offer real-time tracking of logistics. The system uses data cleansing, frequent pattern mining, and a logistics trajectory model to enhance decision-making and optimise inventory management.
Araneda-Fuentes et al. (2015) argue that supply chain coordination is achieved through contracts between suppliers and buyers, who both make capacity decisions influenced by demand uncertainty. In this arrangement, the buyer commits to purchasing an order at a reduced price in return for the supplier’s commitment to meet the anticipated demand up to a specified reservation price. The contract includes a penalty for any unused reserved capacity. This model is based on the framework of the newsvendor problem, with the goal of jointly maximising profits while allowing for competitive open market operations from both parties.
Zhong et al. (2015) introduce a novel feature selection technique for text categorisation known as the Discriminative-semi-supervised FreQuent Pattern-based Feature selection (MaFiQ). In this context, a new methodology is selected that integrates Support Vector Machines (SVMs) and semantic correlation metrics, demonstrating superior performance compared to conventional feature selection methods. The strategy of Enhanced Text Classification Accuracy augments document classification by eliminating irrelevant features. Integration of statistical and semantic features utilises word embeddings to improve classification outcomes.
Magni (2015) proposes an alternative method for assessing investments in uncertain conditions, known as the Aggregate Return on Investment (AROI). Traditional methods such as Net Present Value (NPV) and Internal Rate of Return (IRR) reveal several well-documented shortcomings in investment evaluation. AROI was created to overcome these deficiencies, providing a distinct and reliable approach that effectively measures both investment and efficiency types.
Tazvivinga et al. (2015) argue that the application of research necessitates a systematic analysis and management of uncertainties in supply chain operations. The study highlights the significance of data-driven decision-making, automation, predictive analytics, blockchain technology and AI to enhance transparency, agility and operational efficiency within FMCG supply chains. Through semi-structured interviews conducted with 25 senior supply chain professionals in the FMCG sector, the research identifies six key themes that illustrate the connection between digital transformation and supply chain resilience. Data-driven decision-making, supply chain visibility and transparency, enhancing end-to-end tracking via digital tools such as IoT and blockchain, and automation and robotics are some of these themes.
Zhang et al. (2015) argue for the utilisation of real-time, multi-source manufacturing data to develop a dynamic optimisation model for material handling on the shop floor. This model is exemplified through the use of intelligent trolleys that autonomously request transport tasks, which are subsequently assigned based on real-time information. The research highlights the role of auto ID technologies, such as RFID, Bluetooth and Wi-Fi, in improving traceability and operational efficiency within manufacturing processes. A case study demonstrates the system’s effectiveness in minimising empty loading ratios and transport distances.
Wang et al. (2015) argue that inventory rationing in multi-class lost sales systems is essential. They advocate for a combination of dynamic and static rationing strategies. These are optimal prior to order release, while a time-varying policy enhances existing approximations during the replenishment lead time. Consequently, they introduce a simplified dynamic rationing (SDR) policy that surpasses the previous model.
Golmohammadi (2015) argue that the application of the Theory of Constraints (TOC) to enhance job-shop scheduling has been extensively researched. This article examines the Drum-Buffer-Rope (DBR) method within a real-world automotive case study to evaluate its effectiveness. The research investigates the impact of TOC’s heuristic scheduling principles on master production scheduling (MPS), throughput and resource utilisation in intricate job-shop environments. The authors conduct simulations within a multi-bottleneck framework and suggest modifications to current TOC heuristics for practical implementation.
Sun et al. (2015) argue that through effective load management, Combined Heat and Power (CHP) systems can assist manufacturers in lowering electricity expenses and enhancing sustainability. The authors present a Mixed Integer Nonlinear Programming (MINLP) model designed to optimise the scheduling of manufacturing processes alongside CHP operations in accordance with Time-of-Use (TOU) electricity pricing. The proposed algorithm employs Particle Swarm Optimisation (PSO) to effectively reduce the electricity costs incurred by the electric vehicle operator and the operational expenses of the CHP, while meeting production objectives. A numerical case study validates the effectiveness of the proposed model.
Lu and Liu (2015) examine the impact of a vendor entering an e-commerce channel within a dual-channel distribution system, as opposed to a single-channel distribution system, in a two-echelon supply chain. Their findings indicate that manufacturers do not necessarily benefit from entering e-commerce, especially when the efficiency of the e-channel is low. This situation could be advantageous for physical retailers, as it leads to a decrease in wholesale prices. The prevalence of e-commerce versus traditional channels is contingent upon customer acceptance and the efficiency of the respective channels. By modelling the interactions between manufacturers and retailers, the article employs a game-theoretic approach to create a framework that encourages the investigation of strategic decisions related to pricing and channel management in the context of manufacturer-retailer dynamics.
González-Varona et al. (2020) assert that integrating adaptation and innovation is essential for digital transformation (DT) in small and medium-sized enterprises (SMEs). They critique current maturity models for being unsuitable for SMEs and propose the Organisational Competence for Digital Transformation (OCDT) model, focusing on governance, alignment, culture, technology, and employee capabilities to improve digital competitiveness. The authors emphasise that SMEs must cultivate crucial skills despite limited resources. Furthermore, Tan et al. (2015) recommend that firms leverage analytical infrastructure to maximise innovation by using big data for decision-making. Their case study of an eyeglass manufacturer illustrates that data mining and deduction graphs can enhance supply chain operations and strategic decisions, suggesting that combining big data analytics with structured decision models boosts efficiency and competitiveness.
Fosso Wamba et al. (2019) present a framework for categorising big data research, emphasising its role in enhancing decision-making, business models, and operational efficiency through real-time analytics and automated decision-making. However, the study lacks industry-specific insights, mainly addressing emergency services. Golini and Kalchschmidt (2015) extend their prior work by analysing contingency factors like company size and product complexity using data from the International Manufacturing Strategy Survey (IMSS). They confirm that global sourcing raises inventory levels, although Supply Chain Management Integration (SCMI) mitigates this, especially in larger firms and those with fewer suppliers. Their study’s limitations include a need for a Cost-Benefit Analysis of SCMI, a focus limited to manufacturing without addressing services or retail, and a superficial examination of supplier relationship quality.
Additionally, there is mixed evidence of the relationship between digital transformation and corporate performance in terms of different financial indicators. Digital transformation (DM) negatively impacts both Return on Assets (ROA) and Return on Equity (ROE) in the short term. This decline is primarily attributed to substantial investments in Information Technology (IT), which lead to increased costs and lower ROA until the advantages of these investments are fully realised, a process that can take several years. Conversely, DM has a positive long-term effect on Tobin’s Q, which measures market value in relation to asset value. This positive influence reflects the market’s expectations of future benefits and enhanced performance resulting from digital transformation initiatives (Jardak & Ben Hamad, 2022). In addition, digital transformation initiatives using the likes of AI, automation, and IoT lead to a considerable improvement in operational efficiency that leads to a reduction in costs and an increase in profits (Kamble et al., 2020). It also seeks to affect financial performance, improve total assets, earnings after taxes, and shareholders’ funds and has little impact on tax liabilities (Valaskova et al., 2025).
Some of the variables used to construct and understand a Digital Transformation Index by Yue (2024) are asset liability ratio, capital adequacy ratio, ROE and non-performing loan ratio. While the asset liability ratio helps assess the capital structure of banks, the capital adequacy ratio ascertains the risk resistance capabilities of banks, ROE ratio measures the bank’s ability to utilise its own capital. It gives returns on shareholders’ capital. Non-performing loan ratio measures the risk of bank loans and the size of banks (Yue, 2024).
It is also important to understand the linkages between digital transformation and the ecological performance of companies, given all the emphasis on sustainability in corporate operations. A study by Wang et al. (2022) investigates the association between digital transformation and the environmental performance of companies in China. The study concludes that digital transformation enhances total factor productivity, stimulates green innovation, and strengthens internal governance controls, which collectively lead to a decrease in pollution emissions in firms. Importantly, the research finds that the effects of digital transformation on environmental pollution are more pronounced in state-owned enterprises (SOEs), industries with high pollution levels, and in the more developed eastern regions of China. These insights are particularly valuable for investors and businesses within the Chinese stock markets, as they highlight the significance of digital transformation in advancing corporate social responsibility (CSR). Moreover, the findings are relevant for emerging market economies, offering direction on improving environmental performance through digital initiatives (Wang et al., 2022). Xie et al. (2023) also contend that digital transformation improves enterprises’ ecological performance. It also strengthens the positive impact of green technological innovation sharing among like-minded firms, leading to widespread dissemination and adoption of green technology innovation (Xie et al., 2023).
The next section explains the methodology of this study.
Methodology
The objective of this research is to evaluate the FMCG sector where financial and operational information is publicly available, concentrating on India’s six major FMCG companies, in order to analyse the impact of digital transformation on profitability. This research assesses publicly available financial and operational information from six leading Indian FMCG firms to examine the effects of digital transformation on their profitability. Key data sources are annual reports and investor presentations (available on company’s websites), Earnings calls and transcripts (based on data from Alpha, Moneycontrol and NSE/BSE filings), Financial data (Bloomberg, CMIE Prowess and Capital IQ), industry insights and reports (NASSCOM, FICCI, Deloitte and KPMG); and news articles and expert commentary (ET Retail, Business Standard and Financial Express).
For the purpose of this research, the explanatory variable is the Digital Transformation Index. This index includes references to digital transformation in corporate filings, the contribution of e-commerce and direct-to-consumer channels to revenue, disclosed investments in IT, digital transformation and initiatives aimed at digitising the supply chains, such as inventory optimisation and AI-driven demand forecasting. Dependent variables are gross margin (%) (Data from ProwessIQ and MoneyControl), net profit margin (%) (Data from ProwessIQ and MoneyControl), inventory turnover ratio (Data from ProwessIQ and MoneyControl) and capital employed using return on equity (ROCE) (Data from ProwessIQ and MoneyControl). This research employs a combination of descriptive (trends of digital transformation for investments and profitability metrics over time), longitudinal (5-year relationship between digital transformation indicators and profitability metrics), comparative case-based analysis and digital adoption in terms of low versus high for the five companies. Table 1 lists the weights for each metric used in calculating the Digital Transformation Index, along with the reasons for selecting them. So, the Digital Transformation Index comprises the five metrics of Net Cash Flow Growth, Net Profit Margin Change, Inventory Turnover Change, ROCE and Gross Profit Margin Change for the purpose of calculating the composite score by summing up all these components/metrics. The time period for this analysis is 2019–2020 to 2023–2024 (5-year period).
Table 1. Weights Assigned to Each Metric for Calculating the Digital Transformation Index.
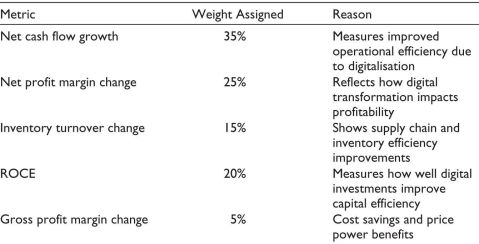
These weights are assigned in accordance with their respective significance for a company’s financial health on a scale of 100. Robust net cash flows are an indicator of a company’s increasing liquid assets, enabling it to cover its obligations, reinvest in businesses, pay its expenses and effectively meet future financial challenges (Hayes, 2025a). The other important variable is the net profit margin change. The same is positive in the case of a company’s financial strength and operational efficiency, and is an indicator of its business strategy bearing desired results (Palasciano, 2025). The other important ratio is inventory turnover change, which measures a firm’s ability to efficiently sell and replace its inventories using state-of-the-art technologies (including digital tech) (Fernando, 2025). ROCE measures a company’s profitability and efficiency in generating profits using its capital (Hayes, 2025b). Last, gross profit margin change indicates the money a company makes from its core operations prior to accounting for its selling, general and administrative costs (Bloomenthal, 2025). As discussed earlier, our Digital Transformation Index comprises the five metrics of Net Cash Flow Growth, Net Profit Margin Change, Inventory Turnover Change, ROCE and Gross Profit Margin Change for the purpose of calculating the composite score by summing up all these components/metrics. The time period for this analysis is 2019–2020 to 2023–2024 (5-year period). The same is being calculated for the five leading companies in India’s FMCG landscape that are also pioneers in digital transformation initiatives, ranging from their management to operational processes, as evident from their annual reports.
This study seeks to assess the following. First, measuring the effects of digital transformation on firm profits. Second, determining if firms with larger digital investments have better profit growth. Third, rating companies for their effectiveness in digital transformation. Last, monitoring important trends in the operating ratios of respective firms.
Results and Discussion
Based on Table 2, it could be stated that first, Hindustan Unilever Limited (HUL) is one of the accomplished FMCG firms in India, when it comes to performance. Strong investments in digital supply chain efficiencies, automation and analytics-driven demand forecasting have enhanced its operational performance (+103.7%). Stable Revenue Turnover and Positive ROCE have further contributed to HUL’s superior performance. Lower net profit margin of –3.7% in FY24 has been bolstered by the company’s elevated capital allocation through its digital transformation initiatives, increasing ROCE to +6.77%. Gross profit margin change stands at –0.68% as immediate gains in profitability are not forthcoming due to the sluggish pace of technology adoption.
Table 2. Comparative Analysis & Scoring of India’s Major FMCG Firms.
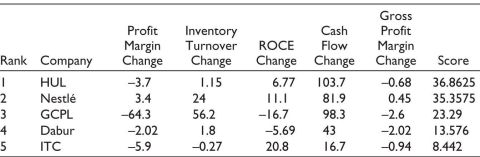
Second, Nestlé has seen positive digital-led efficiency improvements as cash flows have increased by 81.9%, indicating that digital investments made in AI-led inventory management, automation and smart supply chain improvements are paying off. Net profit margins have increased by +3.4% and this is a direct result of digital-first initiatives like direct-to-consumer (D2C) strategies and integration with e-commerce. Inventory Turnover has improved by 24% due to digital tools that have optimised the movement of inventory and improved forecasting to reduce inefficiencies. ROCE has grown by +11.1% as digital transformation has produced better ROCE, favouring capital efficiency.
Third, Godrej Consumer Products Limited (GCPL) has seen inventory gains but no concomitant rise in profitability. Inventory turnover is to the tune of +56.2%, thanks to better management of stocks due to AI-driven demand forecasting and automated replenishment. There is also a shrinkage in the bottom line by 64.3%. As digital transformation requires sizeable initial investments in new technologies and processes, immediate gains in profitability may not be forthcoming, as the pace of technology adoption may be sluggish compared to GCPL’s peers, leading to slower changes in profit margins and even declining margins. Cash flow grew by 98.3% owing to automation-induced efficiency in working capital.
Fourth, Dabur has witnessed minor movements in its price. Operating cash flows grew 43% owing to gradual gains in operational efficiencies. Net profit margins decreased by –2.02%. Digital investments may not be effective at generating revenues or cost savings on a large scale and, as stated earlier, may involve sluggishness in response to digital tech initiatives. Minimal Growth in ROCE at –5.69% is due to less integration with digital transformation.
Last, ITC has seen improvements in ROCE with little growth in cash flows. Due to digital transformation, enabled capital efficiency, ROCE growth increased by 20.8%. However, ITC’s cash flow improvements are lower than the industry average at 16.7%, indicating slower financial returns on digital initiatives. Inventory turnover decreased by 0.27%, owing to the possibility of supply chain digitisation not translating into operational efficiencies.
Some notable limitations of this analysis are listed as follows. First, it utilises a limited range of financial metrics, omitting qualitative factors like employee productivity and customer engagement. Second, this study does not specify digital investment breakdowns within firms, complicating ROI assessments. Third, external factors such as regulations and customer behaviour may significantly influence financial performance, in conjunction with digital transformation efforts. Last, the benefits of digital transformation can take time to manifest, with some companies still in early implementation phases, leading to a lag in financial impact.
Conclusion and Future Policy Implications
This study assesses the impact of digital transformation on five major FMCG companies: Dabur, HUL, GCPL, ITC, and Nestlé, focusing on financial metrics like cash flows, profit margins, and inventory turnover. It finds that digital transformation enhances operational efficiency, financial performance, and supply chain optimisation. HUL excels in cash flows and ROCE, leveraging digital capabilities for a competitive edge, while Nestlé demonstrates financial gains through AI and automation. GCPL improved its inventory turnover but faced profitability challenges, suggesting potential improvements in cost structure. Dabur and ITC appear earlier in their digital journeys. Successful transformation requires technology investments aligned with business goals, process re-engineering, and change management. Companies should personalise digital strategies, and policymakers must enhance digital infrastructure, cybersecurity, and workforce reskilling. Additional incentives could encourage SMEs to adopt digital technologies, focusing on sustainable practices, smart logistics, and AI for waste reduction, ensuring long-term competitiveness and resilience.
Declaration of Conflicting Interests
The authors declared no potential conflicts of interest with respect to the research, authorship and/or publication of this article.
Funding
The authors received no financial support for the research, authorship and/or publication of this article.
ORCID iD
Kanupriya https://orcid.org/0000-0002-4186-4070
Araneda-Fuentes, C., Lustosa, L. J., & Minner, S. (2015). A contract for coordinating capacity decisions in a business-to-business (B2B) supply chain. International Journal of Production Economics, 165, 158–171. https://doi.org/10.1016/j.ijpe.2015.03.016
Bloomenthal, A. (2025). Gross profit margin: Formula and what it tells you. Retrieved, October 30, 2025, from https://www.investopedia.com/terms/g/gross_profit_ margin.asp
Fernando, J. (2025). Inventory turnover ratio: What it is, how it works, and formula. Retrieved, October 30, 2025, from https://www.investopedia.com/terms/i/inventoryturnover.asp
Fosso Wamba, S., Akter, S., Edwards, A., Chopin, G., & Gnanzou, D. (2019). How ‘big data’ can make big impact: Findings from a systematic review and a longitudinal case study. International Journal of Production Economics, 165, 234–246. https://doi.org/10.1016/j.ijpe.2014.12.031
Golini, R., & Kalchschmidt, M. (2015). Managing inventories in global sourcing contexts: A contingency perspective. International Journal of Production Economics, 165, 64–78. https://doi.org/10.1016/j.ijpe.2015.03.022
Golmohammadi, D. (2015). A study of scheduling under the theory of constraints. International Journal of Production Economics, 165, 38–50. https://doi.org/10.1016/j.ijpe.2015.03.015
Hayes, A. (2025a). Cash flow: What it is, how it works, and how to analyze it. Retrieved, October 30, 2025, from https://www.investopedia.com/terms/c/cashflow.asp#toc-what-is-cash-flow
Hayes, A. (2025b). Return on capital employed (ROCE): Ratio, interpretation, and example. Retrieved, October 30, 2025, from https://www.investopedia.com/terms/r/roce.asp
Jardak, M. K., & Ben Hamad, S. (2022). The effect of digital transformation on firm performance: Evidence from Swedish listed companies. The Journal of Risk Finance, 23(4), 329–348.
Kamble, S., Gunasekaran, A., & Dhone, N. C. (2020). Industry 4.0 and lean manufacturing practices for sustainable organisational performance in Indian manufacturing companies. International Journal of Production Research, 58(5), 1319–1337.
Lu, Q., & Liu, N. (2015). Effects of e-commerce channel entry in a two-echelon supply chain: A comparative analysis of single- and dual-channel distribution systems. International Journal of Production Economics, 165, 100–111. https://doi.org/10.1016/j.ijpe.2015.03.001
Magni, C. A. (2015). Aggregate return on investment for investments under uncertainty. International Journal of Production Economics, 165, 29–37. https://doi.org/10.1016/j.ijpe.2015.03.010
Palasciano, A. (2025). What is net profit margin? Formula and examples. Retrieved, October 30, 2025, from https://www.investopedia.com/terms/n/net_margin.asp
Statista. (2025). FMCG in India: Statistics & facts. Retrieved, October 30, 2025, from https://www.statista.com/topics/7736/fmcg-in-india/#topicOverview
Sun, Z., Li, L., Bego, A., & Dababneh, F. (2015). Customer-side electricity load management for sustainable manufacturing systems utilizing combined heat and power generation system. International Journal of Production Economics, 165, 112–119. https://doi.org/10.1016/j.ijpe.2015.04.002
Tan, K. H., Zhan, Y., Ji, G., Ye, F., & Chang, C. (2015). Harvesting big data to enhance supply chain innovation capabilities: An analytic infrastructure based on deduction graph. International Journal of Production Economics, 165, 223–233. https://doi.org/10.1016/j.ijpe.2014.12.034
Valaskova, K., Nagy, M., & Juracka, D. (2025). Digital transformation and financial performance: An empirical analysis of strategic alignment in the digital age. Journal of Enterprising Communities: People and Places in the Global Economy. https://doi.org/10.1108/JEC-11-2024-0241
Wang, D., Tang, O., & Zhang, L. (2015). A note on the rationing policies of multiple demand classes with lost sales. International Journal of Production Economics, 165, 145–154. https://doi.org/10.1016/j.ijpe.2015.03.029
Wang, L., Liu, S., & Xiong, W. (2022). The impact of digital transformation on corporate environment performance: Evidence from China. International Journal of Environmental Research and Public Health, 19(19), 12846.
Xie, J., Zhang, T., & Zhao, J. (2023). Research on the mechanism of digital transformation to improve enterprise environmental performance. Industrial Management & Data Systems, 123(12), 3137–3163.
Yue, D. (2024). How does digital transformation reshape the operating performance of listed banks? In Proceedings of the 2024 5th International Conference on Big Data Economy and Information Management (pp. 812–817). https://dl.acm.org/doi/full/10.1145/3724154.3724288
Zhang, Y., Zhang, G., Du, W., Wang, J., Ali, E., & Sun, S. (2015). An optimization method for shopfloor material handling based on real-time and multi-source manufacturing data. International Journal of Production Economics, 165, 282–292. https://doi.org/10.1016/j.ijpe.2014.12.029
Zhong, R. Y., Huang, G. Q., Lan, S., Dai, Q. Y., Chen, X., & Zhang, T. (2015). A big data approach for logistics trajectory discovery from RFID-enabled production data. International Journal of Production Economics, 165, 260–272. https://doi.org/10.1016/j.ijpe.2015.02.014
Zong, W., Wu, F., Chu, L.-K., & Sculli, D. (2015). A discriminative and semantic feature selection method for text categorization. International Journal of Production Economics, 165, 215–222. https://doi.org/10.1016/j.ijpe.2014.12.03
