
GLIMS Journal of Management Review and Transformation


Hiranmayee Debi1 , Susmita Devi1 and Pranesh Debnath1
1Assam University, Silchar, Assam, India

This article is distributed under the terms of the Creative Commons Attribution-NonCommercial 4.0 License (https://creativecommons.org/licenses/by-nc/4.0/) which permits non-commercial use, reproduction and distribution of the work without further permission provided the original work is attributed as specified on the SAGE and Open Access page (https://us.sagepub.com/en-us/nam/open-access-at-sage).
Despite robust macroeconomic growth in recent decades, India continues to grapple with deep-rooted socioeconomic deprivations, underscoring the need for comprehensive measurement of multidimensional poverty (MP) to understand the true extent of human well-being across its diverse populations. This study examines the evolving socio-spatial dynamics and temporal shifts of MP across India’s states and Union Territories. Utilising secondary data from the National Family Health Surveys (NFHS-4, 2015-2016 and NFHS-5, 2019-2021), the objective is to evaluate regional variations and rural-urban disparities by measuring the headcount ratio (HR), poverty intensity (PI), and the multidimensional poverty index (MPI). Methodologically, the analysis employs descriptive statistics, independent t-tests, and independent one-way ANOVA models. The findings reveal significant macro-level progress, marked by substantial national declines across all three poverty metrics. However, deep-seated regional imbalances remain highly persistent, with acute MP heavily concentrated within the East, Central, and North East Zones. Furthermore, while rural populations exhibit a significantly higher incidence of poverty, the depth and intensity of deprivation among the poor are statistically equivalent across rural and urban sectors, indicating that urban pockets harbour severe structural deprivations comparable to those in rural areas. These findings offer vital policy implications by providing empirical evidence against a one-size-fits-all welfare approach and underscoring the necessity for localised, region-specific, and spatially optimised anti-poverty strategies. The originality of this research lies in its empirical capacity to separate poverty incidence from intensity across the rural-urban dichotomy over time.
Multidimensional poverty index, headcount ratio, poverty intensity, national family health survey, rural–urban disparity
Introduction
Background
Poverty remains one of the most intricate and deeply rooted challenges confronting global development, impacting billions of lives worldwide. Globally, approximately 1.1 billion people (18.3%) across 112 countries live in acute multidimensional poverty (MP), with the heaviest burdens concentrated in Sub-Saharan Africa (553 million) and South Asian countries (402 million) (UNDP & OPHI, 2024). Despite achieving robust economic growth and significant headcount reductions since the 1990s, India continues to anchor a substantial share of the world’s poor. World Bank assessments for 2020 indicated that roughly 176 million Indians subsisted on less than $3.20 per day, while 73 million survived below the extreme threshold of $1.90 per day.
Historically, domestic policy and academic discourse relied on unidimensional measures such as income or consumer expenditure to gauge deprivation. However, these traditional tools have faced widespread criticism for their narrow economic focus and failure to capture the overlapping, non-monetary deprivations experienced by vulnerable populations. To provide a more holistic understanding of human well-being, the MP framework has emerged, evaluating overlapping deprivations across three primary pillars: health, education, and living standards.
The Rural–Urban Divide and Regional Heterogeneity
Macro-level data highlight India’s exceptional progress in poverty alleviation, with approximately 135 million individuals lifted out of MP between 2015-2016 and 2019-2021. Even with these strides, national reports show that 16.4% of the population remains multidimensionally poor, with rural sectors enduring a higher intensity of deprivation than urban core centres. Severe spatial, regional, and socioeconomic imbalances continue to persist across the country (Bagli, 2017; Das et al., 2022; Mishra et al., 2022; Shah & Debnath, 2022). Although existing literature has evaluated MP within single sectors or isolated sub-regions such as rural Tripura (Shah & Debnath, 2022) or specific urban slum environments (Jha & Tripathi, 2023; Shergill, 2023), prior studies suffer from three main analytical limitations:
Sectoral Isolation: Existing studies predominantly analyse rural and urban sectors in isolation or rely on descriptive state-level aggregates, lacking a unified nationwide comparative framework.
Lack of Inferential Testing: Prior empirical assessments rarely apply formal inferential hypotheses (t-tests and one-way ANOVA) to test whether sectoral differences in poverty metrics are statistically significant across large, district-level samples (N = 709).
Incidence vs. Intensity Disaggregation: Existing comparative work fails to decouple overall index scores into headcount ratio (HR) and poverty intensity (PI) across time. Consequently, prior literature overlooks whether rural-urban disparities stem from higher poverty prevalence (HR) or deeper deprivation severity (PI).
This study directly bridges this gap by combining a two-wave temporal design National Family Health Survey (NFHS-4 vs. NFHS-5) with district-level inferential hypothesis testing. By explicitly separating poverty incidence (HR) from intensity (PI), this article evaluates whether structural deprivations in urban areas statistically mirror those in rural sectors, providing a sharper, evidence-based foundation for spatially optimised anti-poverty policy.
Data Source and Study Objectives
The NFHS serve as a comprehensive, high-quality data repository for analysing non-monetary deprivations in India, capturing essential household indicators across healthcare, educational access, and baseline living standards. Drawing from NITI Aayog’s National Multidimensional Poverty Index (MPI) 2024 framework, this study utilises secondary data on the HR, PI, and the composite MPI to evaluate the contemporary landscape of Indian poverty, with a strict focus on rural-urban disparities.
The NFHS serve as a comprehensive, high-quality data repository for analysing non-monetary deprivations in India, capturing essential household indicators across healthcare, educational access, and baseline living standards.
This study adopts NITI Aayog’s exact indicator weights, deprivation cutoffs, and 12-indicator structure (incorporating Maternal Health and Bank Account access alongside the 10 standard global MPI indicators) based on the Alkire-Foster (AF) dual-cutoff methodology (k = 33.33%) (Alkire & Santos, 2011). We did not modify the baseline weighting architecture; rather, we utilised the official district-level MPI dataset derived from this framework across NFHS-4 (2015-2016) and NFHS-5 (2019-2021). While NITI Aayog’s official reports provide valuable baseline descriptive data at the national and state levels, this article adds distinct analytical value by leveraging district-level data (N = 709 districts) to conduct inferential hypothesis testing. Specifically, this study moves beyond descriptive reporting by dissecting the empirical decoupling between poverty incidence (HR) and PI across the rural-urban dichotomy and applying one-way ANOVA models across six statutory administrative zones in India to test for spatial divergence and regional convergence between NFHS-4 (2015-2016) and NFHS-5 (2019-2021); and evaluating whether structural deprivations among urban poor cohorts statistically mirror those found in rural areas.
To guide the empirical investigation, this study outlines three core objectives:
To evaluate national and state-level changes in MP by testing whether the mean differences in HR, PI, and the MPI between NFHS-4 (2015-2016) and NFHS-5 (2019-2021) are statistically significant using paired/ independent sample t-tests.
To empirically test whether the incidence (HR), intensity (PI), and composite index (MPI) of MP differ significantly between rural and urban India across NFHS-4 and NFHS-5 waves using independent-samples t-tests at the district level (N = 709).
To statistically examine spatial variations and temporal convergence/divergence in MPI and its sub-components across six statutory administrative zones of India using independent One-Way Analysis of Variance (ANOVA) models across both survey rounds.
This study contributes to the existing literature on MP in India by comprehensively analysing rural-urban disparities using NFHS data. Its findings have important implications for policymakers and development practitioners working to reduce poverty and inequality in India.
The remainder of this report is organised as follows. Chapter 2 provides a review of the literature on MP, with a focus on India. Chapter 3 describes the data and methodology used in the study. Chapter 4 presents the results of the analysis, including the trends and patterns of MP in India and the rural-urban disparities. Chapter 5 discusses the findings and implications of the study.
Formal Hypotheses Framework
To transition the analysis from exploratory reporting to confirmatory empirical testing, this study formulates three ex-ante hypotheses based on structural and spatial developmental patterns in India:
H1: (Temporal Reduction): The national mean incidence (HR), depth (PI), and overall index (MPI) of MP experienced significant statistical reductions between NFHS-4 (2015-2016) and NFHS-5 (2019-2021).
H2a: (Rural-Urban Incidence Disparity): Rural populations exhibit a significantly higher incidence (HR) and overall composite deprivation (MPI) than urban populations across both NFHS-4 and NFHS-5 survey waves.
H2b: (Rural-Urban Intensity Convergence): The depth and intensity of deprivation (PI) among multidimensionally poor populations do not differ significantly between rural and urban sectors, reflecting equivalent structural deprivation severity in urban slum pockets.
H3: (Macro-Regional Disparity): MPI differs significantly across six statutory administrative zones of India (Central, East, North East, North, South, and West), exhibiting spatial concentration in high-deprivation regional corridors.
Literature Review
Theoretical Foundations of the AF Approach
The conceptualisation of poverty has transitioned from unidimensional monetary metrics (income and consumption expenditure) toward multidimensional approaches capable of capturing acute, overlapping deprivations. Central to this transition is the dual-cutoff methodology developed by AF (2011). The AF methodology identifies the poor through two cutoffs: an indicator-specific deprivation threshold and an overall deprivation score threshold (k), yielding the HR, PI, and the composite MPI = HR ´ PI). Despite its widespread adoption by international bodies like the UNDP and domestic planning institutions like NITI Aayog, the AF counting approach has faced considerable methodological debate in welfare economics:
Global and Comparative International MPI Perspectives
At the global level, MP continues to affect a substantial portion of the population. According to the Poverty, Prosperity, and Planet Report (World Bank, 2024b), approximately 1 in 10 people globally is multidimensionally poor. Deprivations in non-monetary dimensions, like access to schooling and basic infrastructure, compound poverty and perpetuate cycles of inequality. Global assessments reveal that the share of the poor is 64% higher when education and basic infrastructure are added alongside monetary poverty, rising from 8.8% living below $2.15 per day to 14.5% (World Bank, 2024a).
Recent comparative international studies confirm widespread MP across developing economies:
South Asia: Saddique et al. (2023) reported that 22% of people are multidimensionally poor in Pakistan, while Raza and Khan (2025) highlighted pronounced spatial disparities across Pakistani regions. Similar spatial dynamics have been documented in Bangladesh (Sydunnaher et al., 2019) and Myanmar (Mohanty et al., 2018).
Sub-Saharan Africa: Regional studies across Sub-Saharan Africa underscore persistent structural poverty in Nigeria (Deinne & Ajayi, 2019), Ethiopia (Tigre, 2018), and South Africa (Jackson & Yu, 2023; Katumba et al., 2019).
Latin America and Southeast Asia: Parallel MP evaluations in Latin America, such as Brazil (Stankiewicz Serra et al., 2021), and Southeast Asia, such as Indonesia (Hanandita & Tampubolon, 2016), emphasise that non-monetary deprivations remain heavily clustered around rural infrastructure deficits and urban informal settlements.
India-specific Empirical Applications and Regional Disparities
In the Indian context, MP is deeply intertwined with the rural-urban divide, owing to disparities in infrastructure, access to resources, and socioeconomic opportunities. The significance of the national MPI in India is highlighted in studies such as Tripathi and Yenneti (2020), which reveal the extent to which rural and urban areas differ in their deprivation profiles. These variations underscore the need for localised and context-specific policy interventions.
Empirical assessments at the national and sub-national levels demonstrate that while macroeconomic growth has reduced poverty HRs, severe spatial imbalances persist across Indian states and districts (Das et al., 2022; Jatav & Singh, 2025; Vasishtha & Mohanty, 2021). For instance, Roy (2025) emphasised the pivotal role of governance quality in reducing poverty across Indian states, while Sarkar and Das (2018) highlighted the spatial interrelationships between economic growth, inequality, and poverty.
Rural–Urban Disparities in MP
The rural-urban dichotomy plays a pivotal role in shaping the distribution and intensity of MPI in India. Several studies have identified higher MPI scores in rural areas than in urban counterparts. For instance, Das et al. (2022) highlight that rural regions exhibit pronounced deprivation in education and living standards due to limited access to quality services and infrastructure.
Similarly, Mondal et al. (2023) examine poverty trends across Indian states and report that rural populations, particularly in high-burden states like Bihar and Uttar Pradesh, face entrenched deprivations in basic amenities. At the micro-level, Roy et al. (2019) identified key socioeconomic determinants driving rural poverty in West Bengal. However, the disparity is nuanced in urban centres, where slum populations and informal settlements exhibit multidimensional PI levels comparable to rural regions (Kaibarta et al., 2022; Shergill, 2023).
Drivers of Disparities
The drivers of rural-urban disparities in MP are complex and multifaceted. In rural areas, structural deprivations stem from agricultural dependence, inadequate energy grids, and poor sanitation infrastructure. On the other hand, urban poverty is often driven by the informal economy, housing insecurity, and migration-related challenges (Mukherjee, 2021).
Determinants at the household level also play a critical role; Septa et al. (2025) noted that income, education, age, and occupation significantly influence household poverty status across rural Indian districts. Additionally, macro-studies by Singh (2022) illustrate that sectoral growth trajectories and provincial governance policies lead to uneven poverty reduction outcomes across rural and urban sectors.
Regional and Temporal Trends in MP
Temporal analyses of MP in India indicate significant improvements over the years, yet spatial disparities remain stark. According to Tripathi and Yenneti (2020), the overall MPI in India declined by approximately 50% between 2005 and 2016, with rural areas witnessing a sharper absolute reduction than urban areas. However, the absolute poverty levels in rural regions remain disproportionately high. These trends are further corroborated by studies such as Das et al. (2022) and Bagli (2017), which emphasise the need for region-specific poverty alleviation strategies, particularly across North East and Central India.
Policy Implications and Gaps in the Literature
The reviewed literature underscores the importance of targeted interventions to bridge rural-urban disparities. Policies focusing on rural infrastructure development, quality education, healthcare accessibility, and employment generation are critical. Additionally, the role of urban planning in addressing the challenges of urban poverty and informal housing is emphasised (Mukherjee, 2021).
Despite these insights, key gaps in the literature persist:
Intra-Sectoral and Granular Disparities: As Sharma et al. (2022) argue, existing studies often rely on state-level aggregates and overlook intra-urban and district-level disparities.
Decomposition of Headcount versus Intensity: Prior work lacks systematic empirical testing that decouples poverty incidence (HR) from PI across space and time.
Lack of District-Level Inferential Testing: Most studies provide descriptive comparisons rather than formal hypothesis testing (t-tests and ANOVA) across administrative zones using large sample sizes (N > 700). This study directly addresses these gaps by evaluating district-level MP data across NFHS-4 and NFHS-5, applying rigorous inferential models to compare rural-urban dynamics and regional zonal trajectories.
Materials and Methods
This section outlines the methodology employed in this study to examine the status of MP in India, utilising evidence from the NFHS.
Multidimensional Poverty Index
Poverty has traditionally been measured in terms of income, but this approach often fails to capture the broader dimensions of deprivation that affect people’s lives. The United Nations MPI offers a more comprehensive framework for understanding poverty by considering multiple factors beyond income, such as health, education, and living standards. This approach emphasises the incidence (the proportion of poor people) and intensity (the average deprivation score among the poor) of poverty, providing a fuller picture of how poverty affects different populations. The MPI is based on the AF methodology to classify individuals as poor or not poor based on a dual-cutoff method. It assesses acute poverty with 10 indicators across three dimensions: health, education, and standard of living and equal weight is assigned to each dimension. Health includes nutrition and mortality; education covers years of schooling and attendance; and standard of living features six household indicators: housing, assets, cooking fuel, sanitation, drinking water, and electricity. NITI Aayog’s national MPI adopts the AF dual-cutoff approach and includes all 10 global indicators, adding maternal health and bank accounts to meet India’s priorities.
Table 1 summarises the dimension-wise indicators and their respective weightage for calculation of the respective dimension. Rather than modifying or re-weighting the indicators, this study strictly replicates NITI Aayog’s exact weighting schema and poverty cutoffs. A household is identified as multidimensionally poor if its weighted deprivation score (c) equals or exceeds the dual-cutoff threshold of 33.33% (k = 1/3). Adopting NITI Aayog’s exact parameters ensures methodological consistency and benchmark comparability across survey rounds, while our empirical analysis extends this framework through district-level inferential statistics.
| Dimension | Dimension Weight | Indicator | A Household Is Considered Deprived If | Indicator Weight |
| Health | 1/3 | Nutrition | Any child between the ages of 0 and 59 months, or woman between the ages of 15 and 49 years, or man between the ages of 15 and 54 years—for whom nutritional information is available—is found to be undernourished. | 1/6 |
| Child-Adolescent Mortality | A child/adolescent under 18 years of age has died in the family in the 5 years preceding the survey. | 1/12 | ||
| Maternal Health | Any woman in the household who has given birth in the 5 years preceding the survey has not received at least four antenatal care visits for the most recent birth or has not received assistance from trained, skilled medical personnel during the most recent childbirth. | 1/12 | ||
| Education | 1/3 | Years of Schooling | Not even one member of the household aged 10 years or older has completed 6 years of schooling. | 1/6 |
| School Attendance | Any school-aged child is not attending school up to the age at which he/she would complete class 8. | 1/6 | ||
| Standard of living | 1/3 | Cooking Fuel | A household cooks with dung, agricultural crops, shrubs, wood, charcoal or coal. | 1/21 |
| Sanitation | The household has unimproved or no sanitation facility, or it is improved but shared with other households. | 1/21 | ||
| Drinking Water | The household does not have access to improved drinking water or safe drinking water and is at least a 30-minute walk from home (as a round trip). | 1/21 | ||
| Electricity | The household has no electricity. | 1/21 | ||
| Housing | The household has inadequate housing: the floor is made of natural materials, and the roof or wall is made of rudimentary materials. | 1/21 | ||
| Assets | The household does not own more than one of these assets: radio, TV, telephone, computer, animal cart, bicycle, motorbike, or refrigerator, and does not own a car or truck. | 1/21 | ||
| Bank Account | No household member has a bank account or a post office account. | 1/21 | ||
| Toral | 1 | 1 |
Source: NITI Aayog’s National Multidimensional Poverty Index, 2023.
Research Design
This study employed a quantitative research design, using secondary data from different rounds of NFHS conducted in 2015-2016 (NFHS-4) and 2019-2021 (NFHS-5). The NFHS is a nationally representative survey conducted by the International Institute for Population Sciences (IIPS) under the aegis of the Ministry of Health and Family Welfare, Government of India. We have also extracted NITI Aayog’s report on the National MPI published in 2023.
Figure 1 demonstrates how the MPI is constructed from the HR and PI.
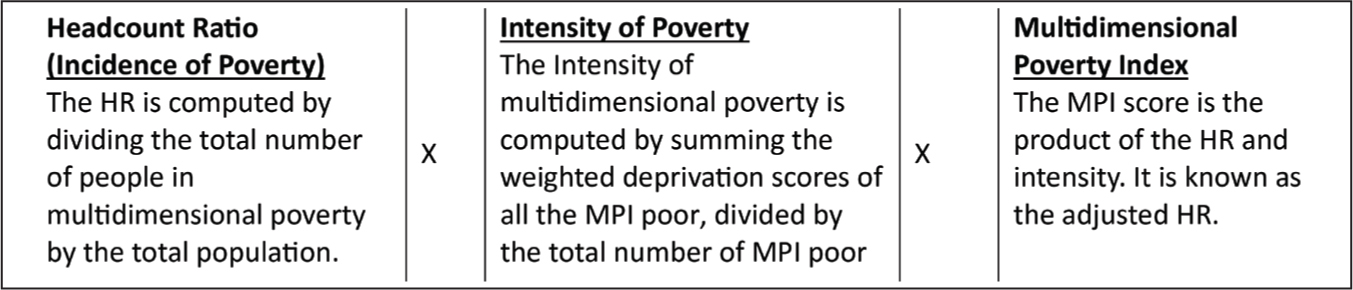
The first indicator is the HR, which measures the proportion of the multidimensionally poor population. It is calculated by dividing the number of multidimensionally poor individuals by the total population. Second, the PI refers to the average percentage of weighted deprivations experienced by people living in poverty, indicating how deeply and broadly they are affected by poverty across different dimensions like health, education, and living standards. The weighted deprivation scores of all needy individuals are summed and then divided by the number of poor individuals to determine the intensity of poverty. Finally, the MPI value is obtained by multiplying the HR by the intensity of poverty (PI), reflecting the proportion of people in poverty and the degree of their deprivation. Therefore, MPI = HR ´ PI — [0 <= MPI <= 1]. The idea of MPI is crucial for poverty measurement because monetary income does not manifest overall human well-being. Summarising the information on the different deprivations into a single index proves useful in making comparisons across populations and across time. Thus, MPI is calculated by considering the incidence and intensity of deprivation of health, education, and living standards. Higher HR, PI and MPI values indicate higher deprivation from basic facilities. Thus, states and UTs showing higher values in HR, PI and MPI indicate high deprivation among the people and vice versa.
The data on HR, PI, and MPI are extracted from the National Multidimensional Poverty Report published by NITI Aayog in 2023, covering 702 districts for NFHS-4 and 706 districts for NFHS-5 across the 36 States and Union Territories (UTs) in India. The analysis employed descriptive statistics, line graphs and inferential statistics. Measures such as mean, maximum, minimum and standard deviation (SD) were utilised to depict the distribution of the studied variables. Line graphs illustrate the trends of variables across states and UTs. A t-test assessed differences in the MPI and its sub-dimensions between two NFHS rounds, 2015-2016 (NFHS-4) and 2019-2021 (NFHS-5), to investigate the reduction in poverty between the two survey rounds. A t-test was also employed to explore the rural-urban divide in MPI. The unit of analysis for all t-tests and One-Way ANOVA models is the district, rather than state-level aggregates, ensuring high statistical power across all six zonal subgroups. In the analysis of district-level data based on availability, we considered 709 districts for NFHS-4 and NFHS-5, which serve as the primary unit of analysis. Given the large sample size (N > 700 districts), the Central Limit Theorem (CLT) ensures that the sample distribution of the mean approaches normality.
Further, to determine whether the observed variations among the six administrative regions identified by the Government of India (i.e., Central Zone, East Zone, North East Zone, North Zone, South Zone, and West Zone) are statistically significant, a One-Way ANOVA has been performed on the MPI scores and sub-dimensions across both survey rounds. The zonal grouping used in this article follows the statutory classification established by the States Reorganisation Act, 1956 (and subsequent amendments, such as the North-Eastern Council Act, 1971), implemented by the Ministry of Home Affairs, Government of India, which groups India into six official Zonal Councils. This regional division is widely adopted by NITI Aayog, the Ministry of Health and Family Welfare (IIPS for NFHS reporting), and economic research institutions for assessing regional developmental convergence and spatial equity across macroeconomic corridors.
To ensure exact replicability for the One-Way ANOVA tests across both NFHS rounds (N = 709 districts), the 36 states and UTs are categorised into six zones as follows:
As detailed in Table 2, the study categorises 36 states and UTs into six administrative zones to evaluate macro-regional developmental disparities. Although the analysis groups states into these macro-regions, individual districts (N = 709) serve as the primary unit of observation. This district-level resolution provides robust statistical power for conducting inferential tests, specifically the One-Way ANOVA models used to examine spatial disparities in poverty incidence, intensity, and overall MPI scores across survey rounds. This structural mapping allows for a rigorous comparison of how MP metrics (HR, PI, and MPI) vary spatially across India’s distinct geographical corridors.
| Zone Name | States and Union Territories | Total District |
| Central zone | Madhya Pradesh, Chhattisgarh, Uttar Pradesh, Uttarakhand. | 78 |
| East zone | Bihar, Jharkhand, Odisha, West Bengal. | 116 |
| North East zone | Arunachal Pradesh, Assam, Manipur, Meghalaya, Mizoram, Nagaland, Sikkim, Tripura. | 178 |
| North zone | Haryana, Himachal Pradesh, Punjab, Rajasthan, Jammu & Kashmir, Ladakh, NCT of Delhi, Chandigarh. | 104 |
| South zone | Andhra Pradesh, Karnataka, Kerala, Tamil Nadu, Telangana, Puducherry, Lakshadweep, Andaman and Nicobar Islands. | 126 |
| West zone | Goa, Gujarat, Maharashtra, Dadra & Nagar Haveli and Daman & Diu. | 107 |
Results and Discussion
Results
Table 3 presents the HR, Intensity, and MPI values of the NFHS 4th round and NFHS 5th round of survey conducted in 2015-2016 and 2019-2021, respectively. The data reveal significant progress in poverty alleviation between NFHS-4 and NFHS-5 in India. Both maximum and average HR values decreased considerably, indicating a reduced proportion of the population living in poverty. Intensity scores, which measure the extent of deprivation among those in poverty, also showed a slight improvement on average. The incidence and intensity of poverty declined, highlighting substantial advancements across various dimensions, including health, education, and living standards. When comparing this to the progress made between NFHS-4 and NFHS-5, poverty alleviation continues.
| Variables | HR | HR | PI | PI | MPI (NFHS-4) | MPI (NFHS-5) |
| Average | 17.37% | 10.24% | 44.04% | 42.28% | 0.08 | 0.04 |
| Maximum | 51.89% | 33.76% | 51.01% | 48.01% | 0.27 | 0.16 |
| Minimum | 0.70% | 0.55% | 35.80% | 36.47% | 0.00 | 0.00 |
| SD | 0.13 | 0.09 | 0.03 | 0.03 | 0.06 | 0.04 |
The MPI values, reflecting overall poverty across multiple dimensions, demonstrated substantial improvement, with both maximum and average values falling. Furthermore, reduced variability (measured through SD) in HR and MPI across regions suggests more uniform progress in poverty reduction during this period.
Figure 2 compares the incidence and intensity of poverty during NFHS-4 (2015-2016) and NFHS-5 (2019-2021), demonstrating significant progress in India in reducing both the HR and the intensity of poverty. The HR, which reflects the percentage of the population living in MP, has markedly declined across most states and UTs, indicating that fewer people now experience multiple deprivations in areas such as health, education, and living standards. Notable improvements can be observed in states like Bihar, where the HR dropped from 51.89% to 33.76%, and Assam, decreased from 32.65% to 19.35%. Even in traditionally well-performing states like Kerala, the HR saw slight reductions (0.70% to 0.55%), maintaining its status as a leader in social development.
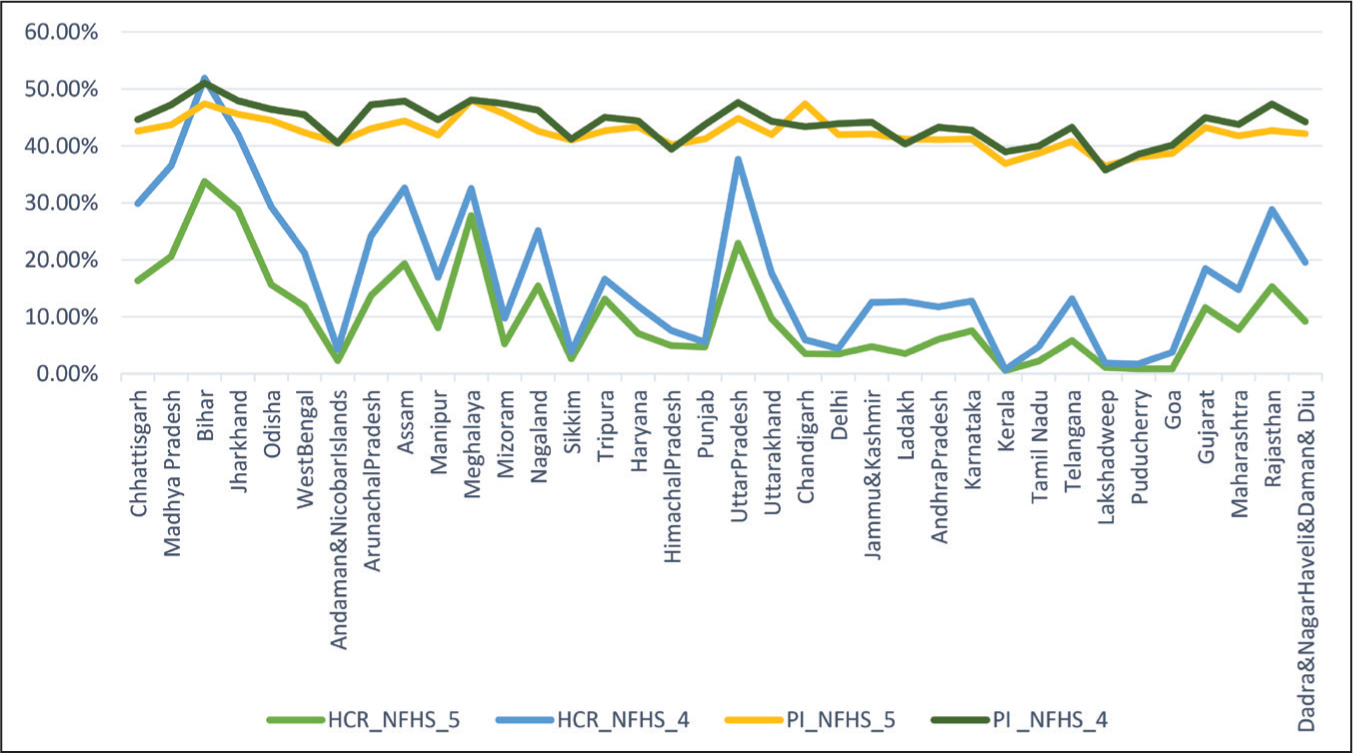
The intensity of poverty, indicating the average deprivation among those identified as poor, also showed reductions in most regions. While Bihar had the highest PI in both survey periods, it witnessed an improvement from 51.01% to 47.40%. Similarly, Assam recorded a reduction in intensity from 47.88% to 44.41%. These trends suggest that fewer people are considered poor, and the depth and severity of their deprivations have lessened. The decline in MP reflects the impact of initiatives to improve access to healthcare, education, and basic amenities. Programmes like Swachh Bharat Abhiyan, rural electrification, and welfare schemes targeting marginalised communities likely played a pivotal role in driving these positive outcomes. However, states like Bihar, Jharkhand, and Madhya Pradesh still exhibit high poverty levels, emphasising the need for sustained and targeted efforts to address regional disparities. This progress is a testament to India’s strides in achieving more inclusive and equitable development, though continued vigilance and innovation are required to ensure this trajectory persists.
In Figure 3, a comparison of the MPI between NFHS-4 (2015-2016) and NFHS-5 (2019-2021) highlights substantial progress in poverty reduction across India’s states and UTs. MPI, which measures both the prevalence and intensity of poverty, has declined across nearly all regions. Notable improvements can be seen in states like Bihar, where MPI fell significantly from 0.265 to 0.16, though it remains among the poorest states, reflecting persistent systemic challenges. Similarly, Assam achieved a notable decline in MPI from 0.156 to 0.086, marking considerable advancements in alleviating MPI. States such as Kerala and Goa consistently demonstrated the lowest MPI, reducing further to 0.002 and 0.003, respectively, underscoring the role of strong social welfare systems and developmental policies. UTs like Delhi and Chandigarh also recorded steady declines, reflecting improved access to basic services and living conditions.
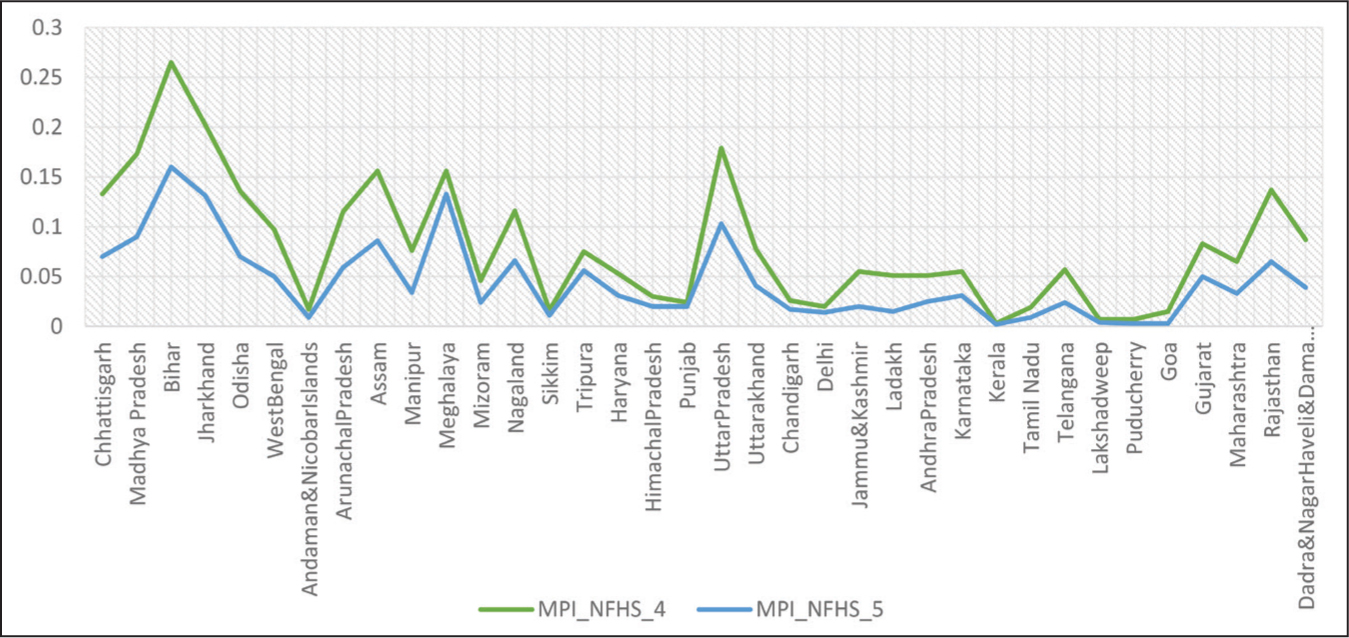
Table 4 presents the results of a t-test comparing HR, PI, and MPI between the two survey periods, NFHS-4 and NFHS-5. The t-test results reveal significant differences in poverty metrics between NFHS-4 and NFHS-5. The HR, measuring the proportion of people living in poverty, dropped from 17.37% in NFHS-4 to 10.24% in NFHS-5, showcasing a substantial improvement. Similarly, PI, which reflects the severity of poverty among the poor, decreased from 44.04% to 42.28%. The MPI, which encompasses various poverty indicators, also declined notably from 8.00% to 4.49%. All changes are statistically significant, as evidenced by small p values.
| Variable | Survey | Mean | Std Dev | T-value | Pr(|T| > |t|) |
| HR | NFHS-4 | 0.1737167 | 0.1289024 | 2.7673 | 0.0072* |
| NFHS-5 | 0.1023806 | 0.0854802 | |||
| PI | NFHS-4 | 0.4404028 | 0.0329488 | 2.4813 | 0.0155* |
| NFHS-5 | 0.4228444 | 0.0267761 | |||
| MPI | NFHS-4 | 0.0800278 | 0.0635922 | 2.8076 | 0.0065* |
| NFHS-5 | 0.0449444 | 0.0397168 |
Note: *Significant at the 1% level.
These findings imply that India has made meaningful progress in poverty alleviation between NFHS-4 (2015-2016) and NFHS-5 (2019-2021). Reductions in HR, PI, and MPI indicate an overall improvement in living conditions, access to resources, and social development. However, the persistence of poverty-related issues, even at reduced levels, suggests that efforts must continue to target vulnerable populations and sustain this positive trajectory. Policymakers may consider these results as a basis for refining anti-poverty programmes and ensuring that the gains are distributed equitably.
Table 5 compares the differences in HR, PI and MPI between two surveys: NFHS-4 (2015-2016) and NFHS-5 (2019-2021) across rural and urban areas. The results reveal significant improvements in all three indicators over time, underscoring progress in poverty alleviation efforts. For rural areas, HR dropped substantially from 0.2214 to 0.1242, indicating fewer households living in MP. Similarly, MPI decreased from 0.1022 to 0.0545, while PI decreased from 0.4429 to 0.4212. These declines reflect meaningful strides toward reducing PI and its prevalence in rural regions. The changes were statistically significant, affirming the effectiveness of targeted programmes or interventions during this period.
| Variable | Survey | Mean | Std Dev | T-value | Pr(|T| > |t|) |
| HR (Rural) | NFHS-4 | 0.2213889 | 0.1484695 | 3.2679 | 0.0017* |
| NFHS-5 | 0.1241694 | 0.0990911 | |||
| HR (Urban) | NFHS-4 | 0.0702361 | 0.0518712 | 2.6280 | 0.0105* |
| NFHS-5 | 0.0431333 | 0.0337402 | |||
| PI (Rural) | NFHS-4 | 0.4429278 | 0.0333438 | 3.0503 | 0.0032* |
| NFHS-5 | 0.4212472 | 0.0265883 | |||
| PI (Urban) | NFHS-4 | 0.430375 | 0.0287622 | 2.2116 | 0.0303** |
| NFHS-5 | 0.4146639 | 0.0314566 | |||
| MPI (Rural) | NFHS-4 | 0.1022222 | 0.0730726 | 3.3148 | 0.0015* |
| NFHS-5 | 0.0544722 | 0.0461597 | |||
| MPI (Urban) | NFHS-4 | 0.0313056 | 0.0247014 | 2.6261 | 0.0106* |
| NFHS-5 | 0.0185556 | 0.015441 |
Note: * and **Significant at the 1% and 5% levels, respectively.
Urban areas also witnessed improvements, though less pronounced compared to rural regions. HR fell from 0.0702 to 0.0431, and MPI dropped from 0.0313 to 0.0186. The PI decreased from 0.4304 to 0.4147. The statistical significance of these results reinforces progress in urban poverty reduction, though it suggests a relatively slower pace than in rural areas.
The findings suggest that efforts to reduce MP have been fruitful, particularly in rural areas where the reductions are more pronounced. This highlights the effectiveness of rural-focused policies and initiatives during the survey period. The persistent gap between rural and urban improvements calls for balanced development approaches to ensure equitable poverty alleviation across regions. Additionally, the statistical significance of the results supports adopting similar strategies in future poverty reduction efforts.
Figure 4 summarises the incidence and intensity of poverty between rural and urban areas based on NFHS-5. The rural-urban comparison of MP based on the HR and PI during NFHS-5 (2019-2021) highlights the persistent rural disadvantage in India. Rural areas consistently show higher HR across states, indicating a higher prevalence of poverty than in urban regions. For instance, Bihar demonstrates a striking rural-urban divide, with a rural HR of 36.95% compared to 16.67% in urban areas, reflecting widespread MP in its rural population. Similarly, states like Assam and Madhya Pradesh exhibit rural HR significantly higher than urban levels, at 21.41% versus 6.88% and 25.32% versus 7.10%, respectively. Even in states with overall low poverty, such as Kerala and Goa, rural areas continue to show slightly higher HRs, emphasising the need for targeted rural interventions. While generally higher in rural areas, PI shows smaller gaps than HR, with rural populations experiencing marginally deeper poverty. For example, in Bihar, rural PI is 47.52%, slightly exceeding the urban intensity of 45.95%.
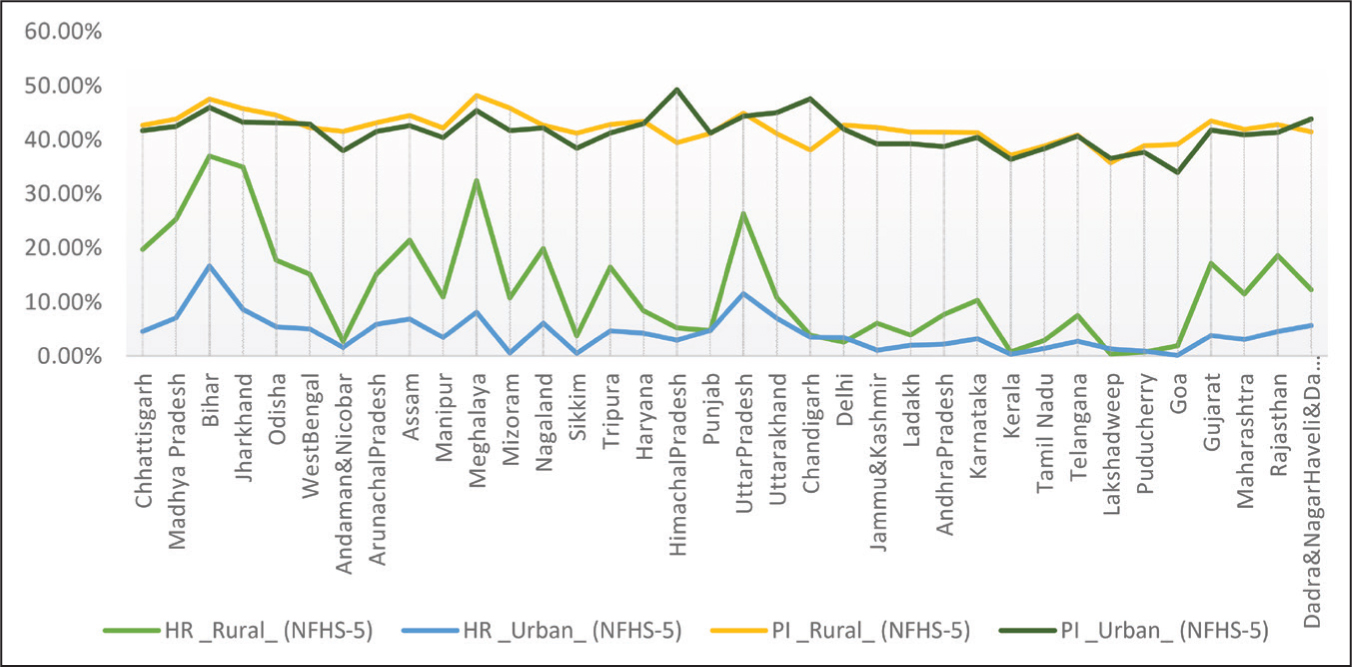
Some exceptions exist, such as Himachal Pradesh and Chandigarh, where urban PI surpasses rural levels, suggesting pockets of severe deprivation among urban populations. These trends have important implications, highlighting the systemic disparities between rural and urban areas. The findings underscore the need for sustained rural development initiatives, such as improving healthcare access, education, sanitation, and infrastructure, to address structural inequities. Meanwhile, urban poverty hotspots require targeted strategies to address deep deprivations among vulnerable populations in cities. Bridging these rural-urban gaps is critical to achieving more equitable and inclusive development and realising India’s Sustainable Development Goals (SDGs).
Figure 5 presents the rural-urban comparison of the MPI from NFHS-5 (2019-2021). The line graph highlights significant disparities, with rural areas consistently facing higher levels of MP than urban areas. Rural MPI values reflect more profound deprivation across health, education, and living standards due to systemic challenges such as inadequate infrastructure and limited access to essential services. For instance, Bihar and Jharkhand, among the poorest states, show stark contrasts between rural and urban areas, with rural MPIs of 0.176 and 0.16, respectively, compared to 0.08 and 0.04 in urban regions. Meanwhile, states like Kerala and Goa maintain extremely low MPI values in both rural and urban areas, demonstrating the success of inclusive social and developmental policies. Certain regions, such as Punjab, show minimal rural-urban disparities, with MPI values of 0.02 for both areas, suggesting more equitable resource distribution.
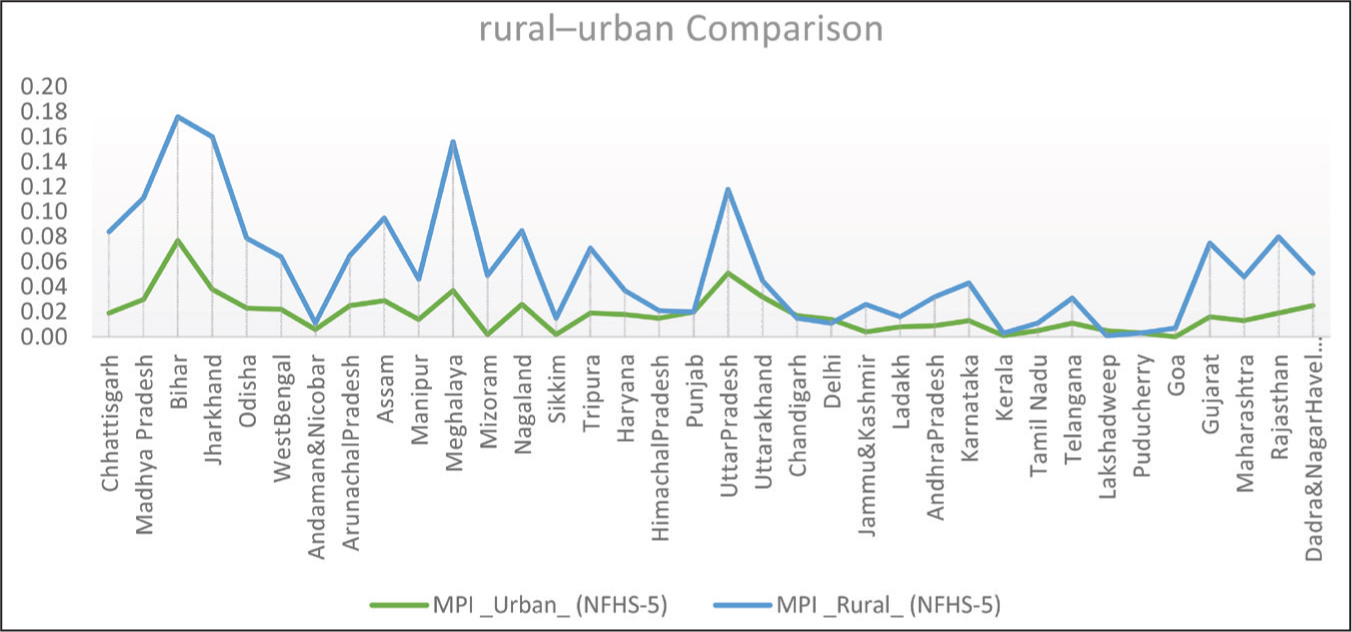
The implications of these findings are crucial for policy formulation. The stark rural-urban divide underscores the need to bolster rural development programmes by improving healthcare, education, employment opportunities, and infrastructure. Programmes like rural electrification, housing schemes, and sanitation initiatives must continue and expand to address structural inequalities. Urban poverty, though comparatively lower, highlights pockets of deprivation that require targeted interventions, particularly in rapidly urbanising states. Addressing these disparities is essential for achieving equitable and inclusive growth, ensuring that the most marginalised populations are not left behind. These trends align with India’s broader commitment to the SDGs, particularly those addressing poverty, inequality, and sustainable development.
Table 6 examines the differences in MP indicators, HR, PI and MPI between rural and urban areas, based on NFHS-4 (2015-2016) and NFHS-5 (2019-2021). Across both surveys, rural areas consistently exhibit higher levels of poverty compared to urban areas, as reflected in all three metrics. These differences are statistically significant for HR and MPI, underscoring substantial disparities in MP prevalence between the two regions.
| Variable | Survey | Mean | Std Dev | T-value | Pr(|T| > |t|) |
| HR (NFHS-4) | Rural | 0.2213889 | 0.1484695 | 5.7666 | 0.0000* |
| Urban | 0.0702361 | 0.0518712 | |||
| HR (NFHS-5) | Rural | 0.1241694 | 0.0990911 | 4.6449 | 0.0000* |
| Urban | 0.0431333 | 0.0337402 | |||
| PI (NFHS-4) | Rural | 0.4429278 | 0.0333438 | 1.7104 | 0.0916 |
| Urban | 0.430375 | 0.0287622 | |||
| PI (NFHS-5) | Rural | 0.4212472 | 0.0265883 | 0.9590 | 0.3409 |
| Urban | 0.4146639 | 0.0314566 | |||
| MPI (NFHS-4) | Rural | 0.1022222 | 0.0730726 | 5.5163 | 0.0000* |
| Urban | 0.0313056 | 0.0247014 | |||
| MPI (NFHS-5) | Rural | 0.0544722 | 0.0461597 | 4.4274 | 0.0000* |
| Urban | 0.0185556 | 0.015441 |
Note: *Significant at the 1% level.
In terms of the HR, which measures the proportion of individuals living in MP, rural areas report significantly higher averages than urban areas in both survey periods. For NFHS-4, rural HR was 0.2214 compared to 0.0702 in urban areas, with a highly significant T-value of 5.7666 (p = .0000). A similar pattern persists in NFHS-5, where rural HR was reduced to 0.1242 yet remained significantly higher than the urban figure of 0.0431 (T-value: 4.6449, p = .0000). These findings highlight that while progress has been made in reducing poverty in both rural and urban settings, rural areas continue to face significantly higher poverty prevalence.
Regarding PI, which reflects the average deprivation intensity experienced by those in poverty, differences between rural and urban areas are less pronounced and statistically insignificant. For NFHS-4, rural PI (0.4429) was slightly higher than urban PI (0.4304), but the difference was not statistically significant (T-value: 1.7104, p = .0916). Similarly, in NFHS-5, rural PI stood at 0.4212 and urban PI at 0.4147, with a T-value of 0.9590 and a p value of .3409. These findings suggest that while the intensity of poverty may be similar across rural and urban areas, the greater prevalence of poverty in rural regions remains a critical concern.
For the MPI, which aggregates HR and PI to provide an overall measure of MP, rural areas again exhibit significantly higher values than urban areas. In NFHS-4, the rural MPI was 0.1022, markedly higher than the urban MPI of 0.0313, with a T-value of 5.5163 (p = .0000). The same trend is observed in NFHS-5, where the rural MPI dropped to 0.0545 but remained significantly higher than the urban MPI of 0.0186 (T-value: 4.4274, p = .0000). This consistent disparity reflects the persistent challenges faced by rural populations in overcoming MP during the study period.
The findings emphasise the persistent and significant disparities in poverty between rural and urban areas, particularly in terms of HR and MPI. Despite improvements over time, rural areas continue to face disproportionately higher poverty levels, indicating the need for focused and region-specific interventions. While the similarity in PI suggests some alignment in the depth of poverty across regions, the higher prevalence in rural areas underscores the urgency of targeted poverty reduction programmes. Policymakers should prioritise addressing the structural factors driving rural poverty, such as limited access to quality education, healthcare, and economic opportunities. Investments in rural infrastructure, skill development, and social protection mechanisms could help bridge the gap between rural and urban poverty levels. At the same time, urban poverty dynamics should not be overlooked, as rapid urbanisation could exacerbate vulnerabilities in specific segments of the population. Achieving balanced and inclusive development requires coordinated efforts to ensure that no region is left behind in the fight against MP.
Figure 6 illustrates the region-wise MPI scores across the six geopolitical zones of India, capturing the temporal shifts between the NFHS-4 (2015-2016) and NFHS-5 (2019-2021) survey rounds. The data reveal a universal and substantial decline in MP across all six regions during the study period, demonstrating the widespread positive impact of targeted developmental interventions and social welfare schemes. In NFHS-4, the Central Zone exhibited the highest level of multidimensional deprivation with an MPI score of 0.153, closely followed by the East Zone at 0.143. By NFHS-5, while both regions achieved remarkable poverty reduction, the East Zone emerged as the most deprived region with an MPI score of 0.084, marginally exceeding the Central Zone’s score of 0.080. The North East Zone also demonstrated notable progress, experiencing a drop in its MPI score from 0.095 to 0.059.
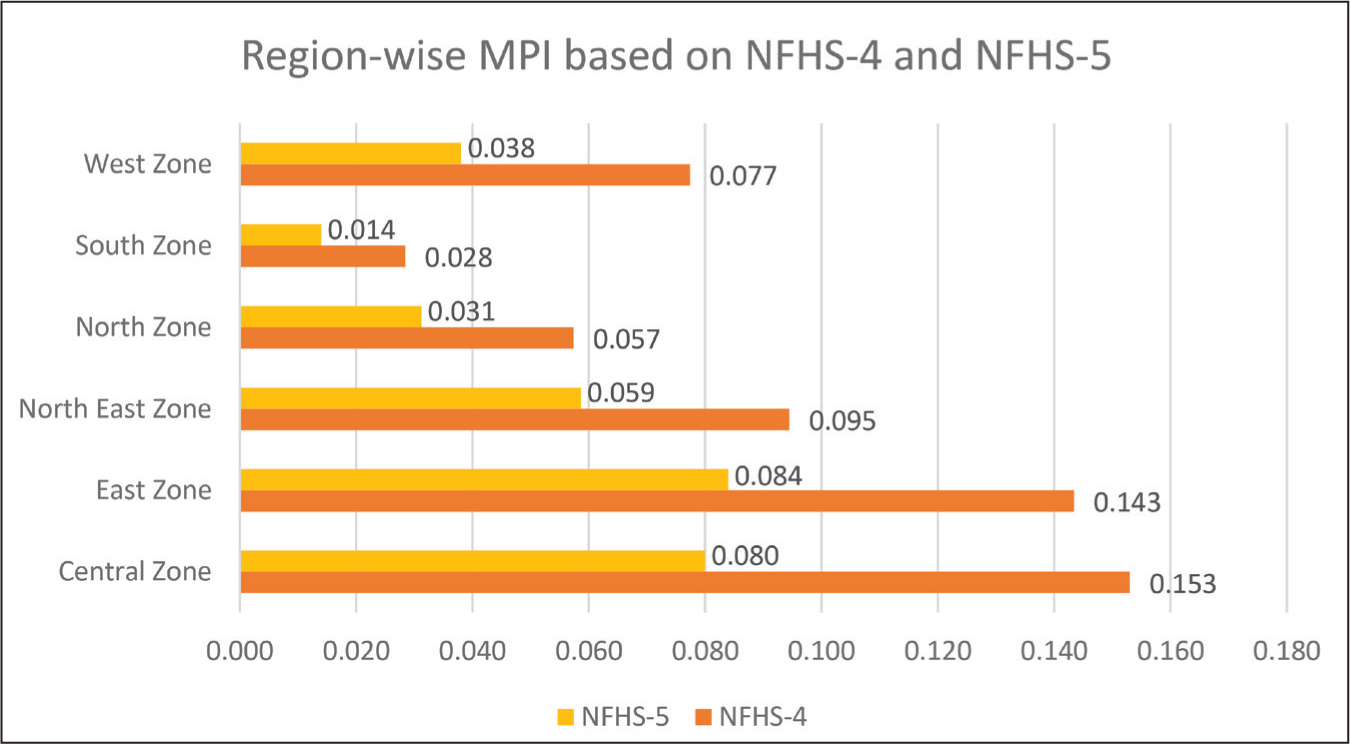
In sharp contrast, the West, North, and South Zones consistently maintained significantly lower poverty thresholds across both periods. The South Zone, which recorded the lowest deprivation levels in the country, successfully halved its MPI score from 0.028 in NFHS-4 to a highly commendable 0.014 in NFHS-5. Similarly, the West Zone cut its index score nearly in half from 0.077 to 0.038, while the North Zone registered a parallel drop from 0.057 to 0.031. These pronounced variations highlight deep-seated macro-regional imbalances; despite uniform national progress, the burden of acute MP remains disproportionately concentrated within the East, Central, and North East Zones. These findings strongly reinforce the need for policymakers to transition from generalised national strategies toward targeted, region-specific, and spatially optimised poverty alleviation programmes that address the structural vulnerabilities unique to India’s high-deprivation corridors.
The statistical significance of macro-regional variations in India’s MP landscape is rigorously confirmed through a One-Way ANOVA performed independently across both survey rounds. The results for the NFHS-4 (2015-2016) period presented in Table 7 indicate highly pronounced spatial disparities in the MPI between the country’s six geopolitical zones, yielding an exceptionally high and statistically significant variance framework [F(5, 696) = 71.98, p = .0000]. This necessitates the clear rejection of the null hypothesis of regional equality, demonstrating that deep-seated socioeconomic boundaries polarised the zones during the 2015-2016 baseline.
| Source | SS | df | MS | F | p > F |
| Between groups | 1.5656 | 5 | 0.3131 | 71.98 | .0000* |
| Within groups | 3.0277 | 696 | 0..0043 | ||
| Total | 4.5933 | 701 | 0.3174 |
Note: *Significant at the 1% level.
A parallel analysis conducted on the subsequent NFHS-5 (2019-2021) dataset in Table 8 reveals that while massive national welfare expansions led to a noticeable contraction in the overall total sum of squares, falling from 4.5933 to 2.1867 and signalling a general compression of poverty across the country, the regional divide remains remarkably persistent. The NFHS-5 model continues to demonstrate highly robust statistical significance at the strict 1% level [F(5, 700) = 52.87, p = .0000], confirming that structural socio-spatial inequalities were not erased by macro-level improvements. Although the marginal reduction in the calculated F-statistic from 71.98 to 52.87 points to a subtle convergence effect as lagging areas gradually catch up, the persistent between-group variance highlights an ongoing geographic concentration of deprivation. Consequently, these findings mathematically invalidate centralised, uniform policy frameworks and strongly underscore the necessity for localised, region-specific interventions tailored to bridge the persistent developmental gaps between the progressive economic zones and high-deprivation regional corridors.
| Source | SS | df | MS | F | p > F |
| Between groups | 0.5994 | 5 | 0.1198 | 52.87 | .0000* |
| Within groups | 1.5873 | 700 | 0.0023 | ||
| Total | 2.1867 | 705 | 0.1221 |
Note: *Significant at the 1% level.
Discussion
The empirical analysis of MP across India’s states and UTs using the fourth and fifth rounds of the NFHS-4 and NFHS-5 provides a comprehensive view of the changing socio-spatial landscape of deprivation. In alignment with the study’s primary objective to analyse the status and changes in MP, the findings demonstrate a significant national decline in the HR, PI, and the MPI. These observed temporal trends are strongly supported by the existing literature, corroborating the findings of Tripathi and Yenneti (2020), who reported a substantial long-term decline in India’s overall MPI. This macro-level progress highlights the effectiveness of massive, targeted government interventions such as the Swachh Bharat Abhiyan, PM Awas Yojana, and Ayushman Bharat, which have expanded access to healthcare, sanitation, education, and basic infrastructure for a standard of living across marginalised cohorts.
Addressing the second objective, which evaluates rural-urban disparities, the empirical analysis unveils a persistent spatial disadvantage for rural populations. The t-test results reveal a highly significant difference in the incidence (HR) and overall index (MPI) between rural and urban sectors across both survey rounds, demonstrating that rural areas continuously experience higher absolute levels of deprivation. This confirms the foundational arguments laid out by Das et al. (2022) and Mondal et al. (2023), who identified pronounced rural vulnerabilities in education and basic amenities across high-burden states. However, a striking and unexpected point of contrast emerged regarding PI: the empirical difference between rural and urban intensity was found to be statistically insignificant across both NFHS periods. This implies that while a significantly higher portion of the rural population falls under the poverty cutoff, the depth and severity of deprivations experienced by those categorised as poor remain statistically similar across both rural and urban domains. This finding nuances the existing literature by highlighting that urban poverty hotspots, such as the slum areas examined by Kaibarta et al. (2022) and Shergill (2023), harbour deep structural deprivations that parallel the intensity of rural poverty.
Figure 7 presents the summary of the present research objectives, methodology and findings.
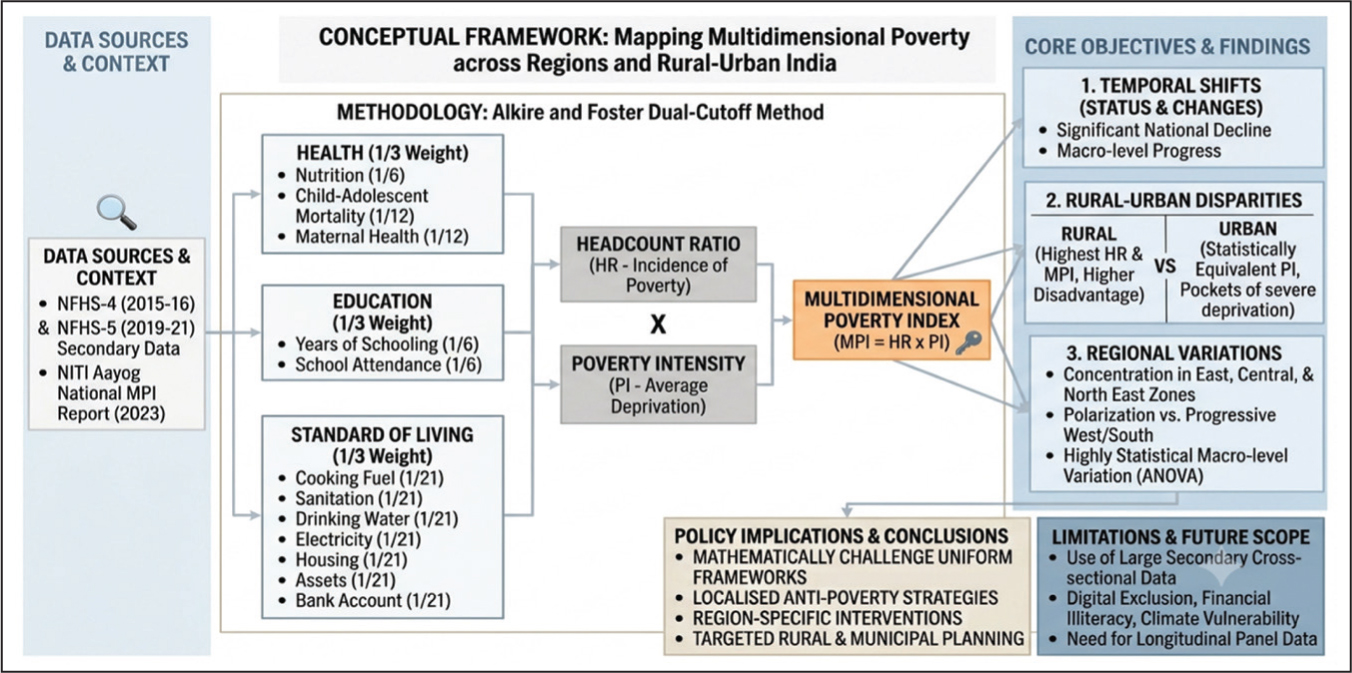
Regarding the third objective, assessing regional variations, the rigorous One-Way ANOVA tests establish that deep-seated macro-regional imbalances remain highly statistically significant, despite widespread progress across all geopolitical zones. While the contraction of the total sum of squares from NFHS-4 to NFHS-5 points to a subtle convergence effect as lagging states gradually catch up, the geographic polarisation persists. The burden of acute MP remains heavily concentrated within the East, Central, and North East Zones, with states like Bihar and Uttar Pradesh continuing to report high MPI levels. These regional trends mirror the spatial distributions highlighted by Vasishtha & Mohanty (2021) and Das et al. (2022), validating the systemic nature of spatial path-dependency in developmental outcomes. In contrast, the southern and western regions continue to outpace the rest of the country due to historically stronger social welfare systems and diverse economic networks, findings that are similar to the existing literature (Jha et al., 2010). Collectively, these findings mathematically challenge the efficacy of generalised, blanket national policies and underscore the immediate necessity for localised, region-specific, and spatially optimised anti-poverty frameworks to eliminate entrenched regional disparities.
Conclusions
Main Findings of the Study
This study evaluates the status, temporal shifts, and socio-spatial dynamics of MP across the states and UTs of India using secondary data from the fourth and fifth rounds of the NFHS-4 and NFHS-5. In alignment with its core objectives, the empirical analysis reveals a significant macro-level decline in the HR, PI and MPI across the country. This general compression of poverty points to the success of targeted national interventions in expanding access to sanitation, healthcare, housing, and basic utilities. However, the investigation into rural-urban disparities reveals a persistent spatial disadvantage for rural populations, which continuously exhibit a significantly higher incidence of poverty (HR) and overall index values (MPI) compared to urban areas. A nuanced insight emerges regarding PI: the depth and severity of deprivation experienced by the poor remain statistically equivalent between rural and urban sectors. This indicates that urban poverty pockets, such as informal settlements and slums, shelter severe structural deprivations that match the intensity found in rural regions. Furthermore, independent One-Way ANOVA tests rigorously confirm that deep-seated macro-regional imbalances persist despite national progress. The burden of acute MP remains heavily polarised and concentrated within the East, Central, and North East Zones, exposing deep structural path-dependencies in regional development.
Policy Implications
The empirical findings of this research carry vital implications for policymakers, urban planners, and development practitioners aiming to fulfil India’s commitments under the SDGs. The stark geographic polarisation and persistent rural-urban gaps mathematically challenge the efficacy of centralised, uniform national welfare frameworks. Consequently, government agencies must transition from generalised, blanket policies toward localised, region-specific, and spatially optimised anti-poverty strategies. First, interventions must aggressively target high-deprivation corridors within the East, Central, and North East Zones by custom-tailoring infrastructure investments to regional needs. Second, given the high prevalence of poverty in rural sectors, sustained rural development initiatives must continue expanding networks for healthcare access, primary education, clean energy grids, and asset creation. Finally, because PI in urban areas mirrors that of rural zones, policymakers cannot ignore urban poverty hotspots. Targeted municipal strategies are urgently needed to address vulnerabilities in the informal economy, housing insecurity, and severe structural deprivations among marginalised urban populations.
Limitations and Future Scope of the Study
While this study contributes a comprehensive, data-driven perspective on spatial inequalities, certain inherent limitations shape its conclusions and open paths for future inquiry. The methodology relies entirely on large-scale secondary, cross-sectional survey data from NFHS rounds, which inherently limits the capacity to monitor real-time, micro-level household transitions or to capture the immediate shocks of shifting macroeconomic policies. Additionally, the standard dimensions of the national MPI used in this study, while robust, may overlook emerging, contemporary facets of structural inequality, such as digital exclusion, financial illiteracy, or localised climate-induced economic vulnerabilities.
To address these gaps, the future scope of research should prioritise the utilisation of longitudinal panel datasets to track the moving dynamics, entry, and exit pathways of households experiencing MP over time. Future empirical models should also seek to expand the conventional framework by integrating context-specific indicators, such as digital literacy, access to financial banking networks, and climate resilience metrics. Lastly, blending these macro-level empirical assessments with localised, mixed-methods field investigations would provide a more granular, qualitative understanding of the institutional and socio-cultural barriers that perpetuate generational poverty across India’s diverse regions.
The authors declared no potential conflicts of interest with respect to the research, authorship and/or publication of this article.
The authors received no financial support for the research, authorship and/or publication of this article.
Hiranmayee Debi https://orcid.org/0009-0003-2214-7468
Pranesh Debnath https://orcid.org/0000-0003-3423-6081
Alkire S., & Foster J. (2011). Counting and multidimensional poverty measurement. Journal of Public Economics, 95(7–8), 476–487. https://doi.org/10.1016/j.jpubeco.2010.11.006
Alkire S., & Santos M. E. (2011). Measuring acute poverty in the developing world: Robustness and scope of the multidimensional poverty index. World Development, 59, 69–84. https://doi.org/10.1016/j.worlddev.2014.01.026
Bagli S. (2017). A study of multidimensional poverty in Northeast India. In De U., Pal M., & Bharati P. (Eds.), Inequality, poverty and development in India (pp. 000–000). Springer. https://doi.org/10.1007/978–981–10–6274–2_10
Das P., Ghosh S., & Paria B. (2022). Multidimensional poverty in India: A study on regional disparities. GeoJournal, 87, 3987–4006. https://doi.org/10.1007/s10708–021–10483–6
Deinne C. E., & Ajayi D. (2019). A socio–spatial perspective of multidimensional poverty in Delta state, Nigeria. GeoJournal, 84, 703–717. https://doi.org/10.1007/s10708–018–9886–z
Hanandita W., & Tampubolon G. (2016). Multidimensional poverty in Indonesia: Trend over the last decade (2003–2013). Social Indicators Research, 128, 559–587. https://doi.org/10.1007/s11205–015–1044–0
Jackson S., & Yu D. (2023). Re–examining the multidimensional poverty index of South Africa. Social Indicators Research, 166, 1–25. https://doi.org/10.1007/s11205–023–03062–4
Jatav S. S., & Singh P. (2025). Tracking trends of multidimensional poverty in different mainstream agro–climatic regions in India: A geo–spatial analysis. Indian Journal of Human Development, 19(1), 135–148. https://doi.org/10.1177/09737030251346758
Jha D. K., & Tripathi V. K. (2023). Unveiling the complexity of urban poverty: Exploring spatial and multidimensional deprivation in slums of Varanasi, India. GeoJournal, 88, 6561–6575. https://doi.org/10.1007/s10708–023–10986–4
Jha R., Gaiha R., & Sharma A. (2010). Mean consumption, poverty and inequality in rural India in the 60th round of the National Sample Survey. Journal of Asian and African Studies, 45(5), 485–503. https://doi.org/10.1177/0021909610373892
Kaibarta S., Mandal S., Mandal P.,. (2022). Multidimensional poverty in slums: An empirical study from urban India. GeoJournal, 87(Suppl. 4), 527–549. https://doi.org/10.1007/s10708–021–10571–7
Katumba S., Cheruiyot K., & Mushongera D. (2019). Spatial change in the concentration of multidimensional poverty in Gauteng, South Africa: Evidence from quality of life survey data. Social Indicators Research, 145, 95–115. https://doi.org/10.1007/s11205–019–02116–w
Mishra P. K., Kumar S., Arif, Mohd., Niyazi A.–U., & Kaur K. (2022). Poverty in multidimensional perspective: Policy insights from selected north Indian districts. Millennial Asia, 13(2), 289–316. https://doi.org/10.1177/0976399620953396
Mohanty S. K., Rasul G., Mahapatra B.,. (2018). Multidimensional poverty in mountainous regions: Shan and Chin in Myanmar. Social Indicators Research, 138, 23–44. https://doi.org/10.1007/s11205–017–1662–9
Mondal S., Kumar S., & Mishra A. P. (2023). Geographical analysis of multidimensional poverty in India from 2005–2021. Forum Geografic, 18(2), 121–136. https://doi.org/10.5775/fg.2023.070.i
Mukherjee P. (2021). Urban poverty in India: Challenges and opportunities. Social Change Review, 12(1), 45–60.
Raza S. H., & Khan L. (2025). Beyond numbers: Mapping poverty disparities in Pakistan through a spatial lens. Applied Spatial Analysis and Policy, 18, Article 28. https://doi.org/10.1007/s12061–024–09626–2
Roy A. (2025). Multidimensional poverty and quality of governance in Indian states. The Indian Economic Journal, 73(3), 548–566. https://doi.org/10.1177/00194 662241278062
Roy P., Ray S., & Haldar S. K. (2019). Socio–economic determinants of multidimensional poverty in rural West Bengal: A household level analysis. Journal of Quantitative Economics, 17, 603–622. https://doi.org/10.1007/s40953–018–0137–4
Saddique R., Zeng W., Zhao P.,. (2023). Understanding multidimensional poverty in Pakistan: Implications for regional and demographic–specific policies. Environmental Science and Pollution Research. https://doi.org/10.1007/s11356–023–28026–6
Sarkar S., & Das S. (2018). Interrelationship between poverty, growth, and inequality in India: A spatial approach. In Dasgupta R. (Ed.), Advances in growth curve and structural equation modeling (pp. 000–000). Springer. https://doi.org/10.1007/978–981–13–1843–6_5
Septa D., Acharya R., & Dhanora M. (2025). Determinants of multidimensional poverty: A study of the rural district of Madhya Pradesh. Journal of Development Policy and Practice, 10(2), 145–170. https://doi.org/10.1177/24551333241285537
Shah S., & Debnath N. (2022). Determinants of multidimensional poverty in rural Tripura, India. Journal of Quantitative Economics, 20, 69–95. https://doi.org/10.1007/s40953–021–00256–w
Sharma A., Patel V., & Roy S. (2022). Understanding rural and urban poverty dynamics in India. Development Studies Quarterly, 29(3), 210–230.
Shergill A. (2023). Regional variations in urban poverty in India: Pattern and determinants. GeoJournal, 88, 6207–6220. https://doi.org/10.1007/s10708–023–10965–9
Singh T. (2022). Economic growth and the state of poverty in India: Sectoral and provincial perspectives. Economic Change and Restructuring, 55, 1251–1302. https://doi.org/10.1007/s10644–021–09345–5
Stankiewicz Serra A., Yalonetzky G. I., & Maia A. G. (2021). Multidimensional poverty in Brazil in the early 21st century: Evidence from the demographic census. Social Indicators Research, 154, 79–114. https://doi.org/10.1007/s11205–020–02568–5
Sydunnaher S., Islam K. S., & Morshed M. M. (2019). Spatiality of a multidimensional poverty index: A case study of Khulna City, Bangladesh. GeoJournal, 84, 1403–1416. https://doi.org/10.1007/s10708–018–9941–9
Tigre G. (2018). Multidimensional poverty and its dynamics in Ethiopia. In Heshmati A. & Yoon H. (Eds.), Economic growth and development in Ethiopia (pp. 000–000). Springer. https://doi.org/10.1007/978–981–10–8126–2_8
Tripathi S., & Yenneti K. (2020). Measurement of multidimensional poverty in India: A state–level analysis. Indian Journal of Human Development, 14(2), 257–274. https://doi.org/10.1177/0973703020944763
UNDP & OPHI. (2024). Global multidimensional poverty index 2024: Poverty amid conflict. https://hdr.undp.org/system/files/documents/hdp–document/mpireport2024en.pdf
Vasishtha G., & Mohanty S. K. (2021). Spatial pattern of multidimensional and consumption poverty in districts of India. Spatial Demography, 9, 213–240. https://doi.org/10.1007/s40980–021–00089–4
World Bank. (2024a). Global Monitoring Database: Poverty and inequality. https://datatopics.worldbank.org/world–development–indicators/themes/poverty–and–inequality.html
World Bank. (2024b). Poverty, prosperity, and planet report: Pathways out of the polycrisis. https://www.worldbank.org/en/publication/poverty–prosperity–and–planet
